Data-Visualization-Projects
| home page | visualizing debt | critique by design | final project I | final project II | final project III | Repository |
The Hybrid Work Solution: Balancing Career Growth and Productivity for Early-Career Professionals
Outline 🖊️
This project looks at the trade-offs of remote and hybrid work arrangements, with recommendations for early-career professionals. It focuses on how diverse work paradigms affect productivity and career success. It presents hybrid work as a well-balanced option that meets the demands of both flexibility and professional progress by highlighting how managers and employees balance the advantages and disadvantages of each work environment.
- Overview of the shift to remote work during the pandemic and its initial positive effects on productivity and employee satisfaction.
- Highlight the emerging issues with sustaining remote work, especially for early-career professionals who require mentorship and growth opportunities.
Reader’s Objective 📖
As a manager or early-career employee, I want to understand how different work models, affect career development and productivity. I seek practical insights on how to stay productive, engaged, and facilitate career growth in these work environments.
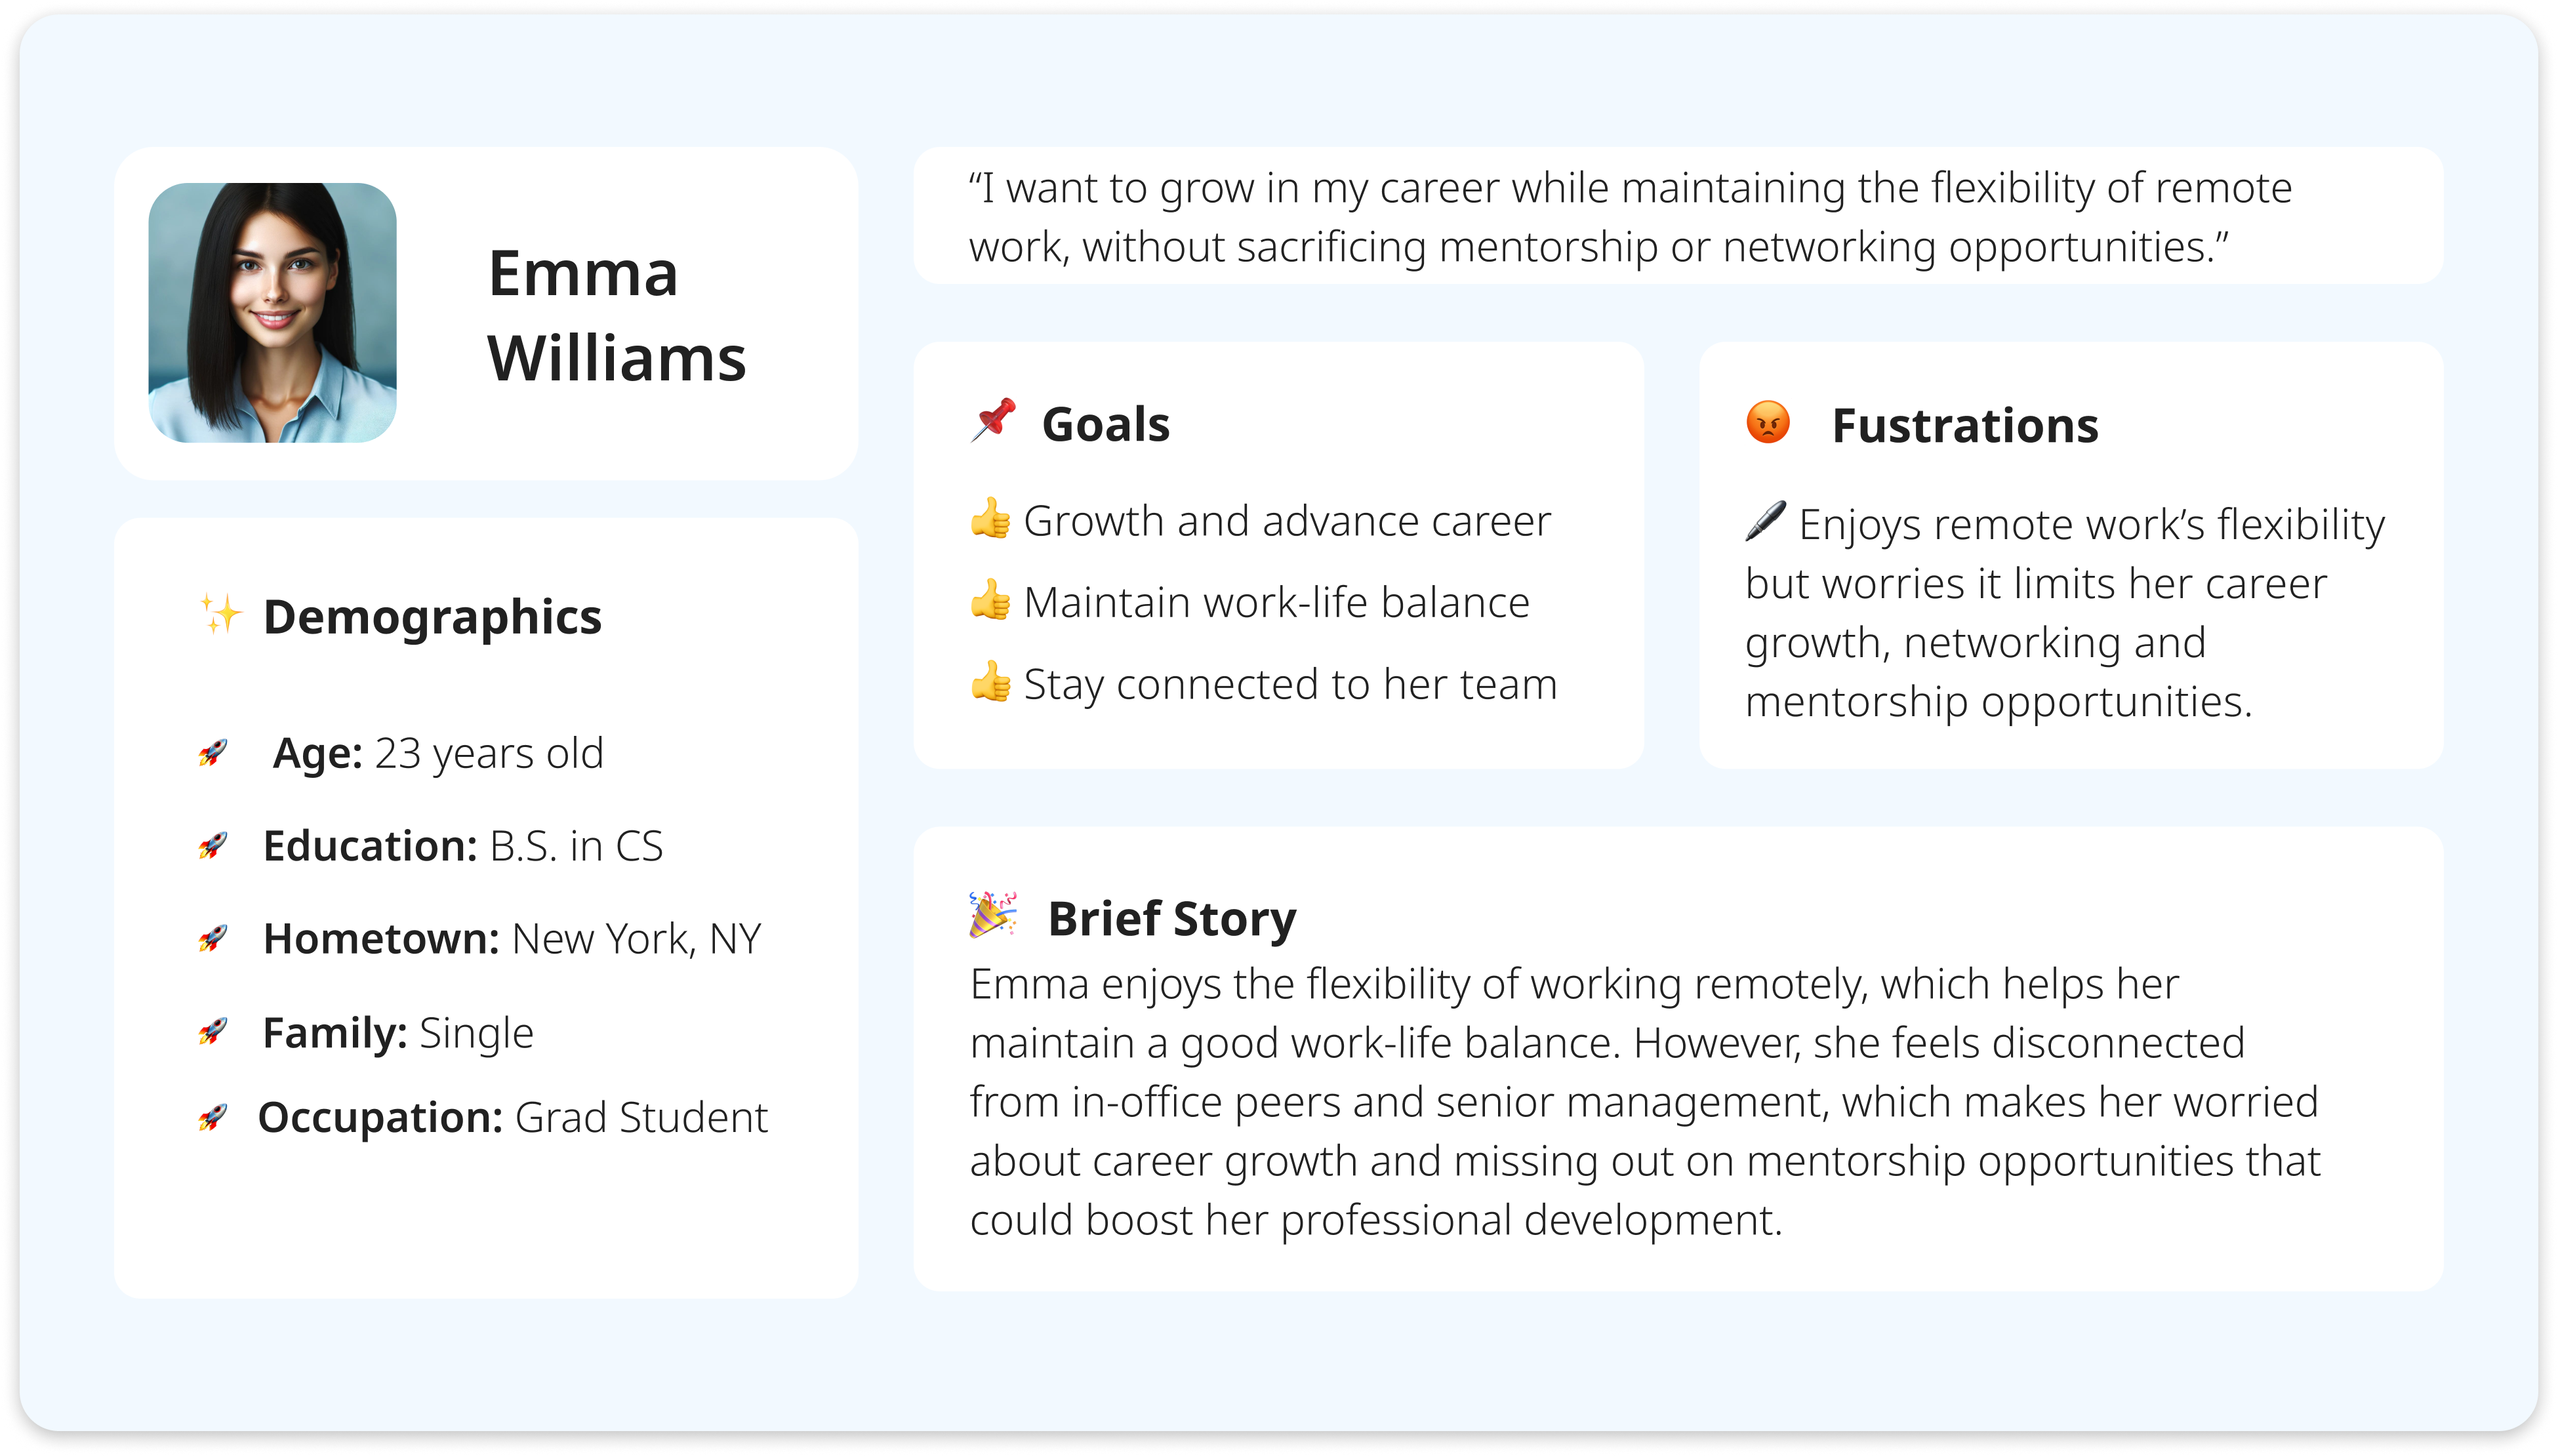
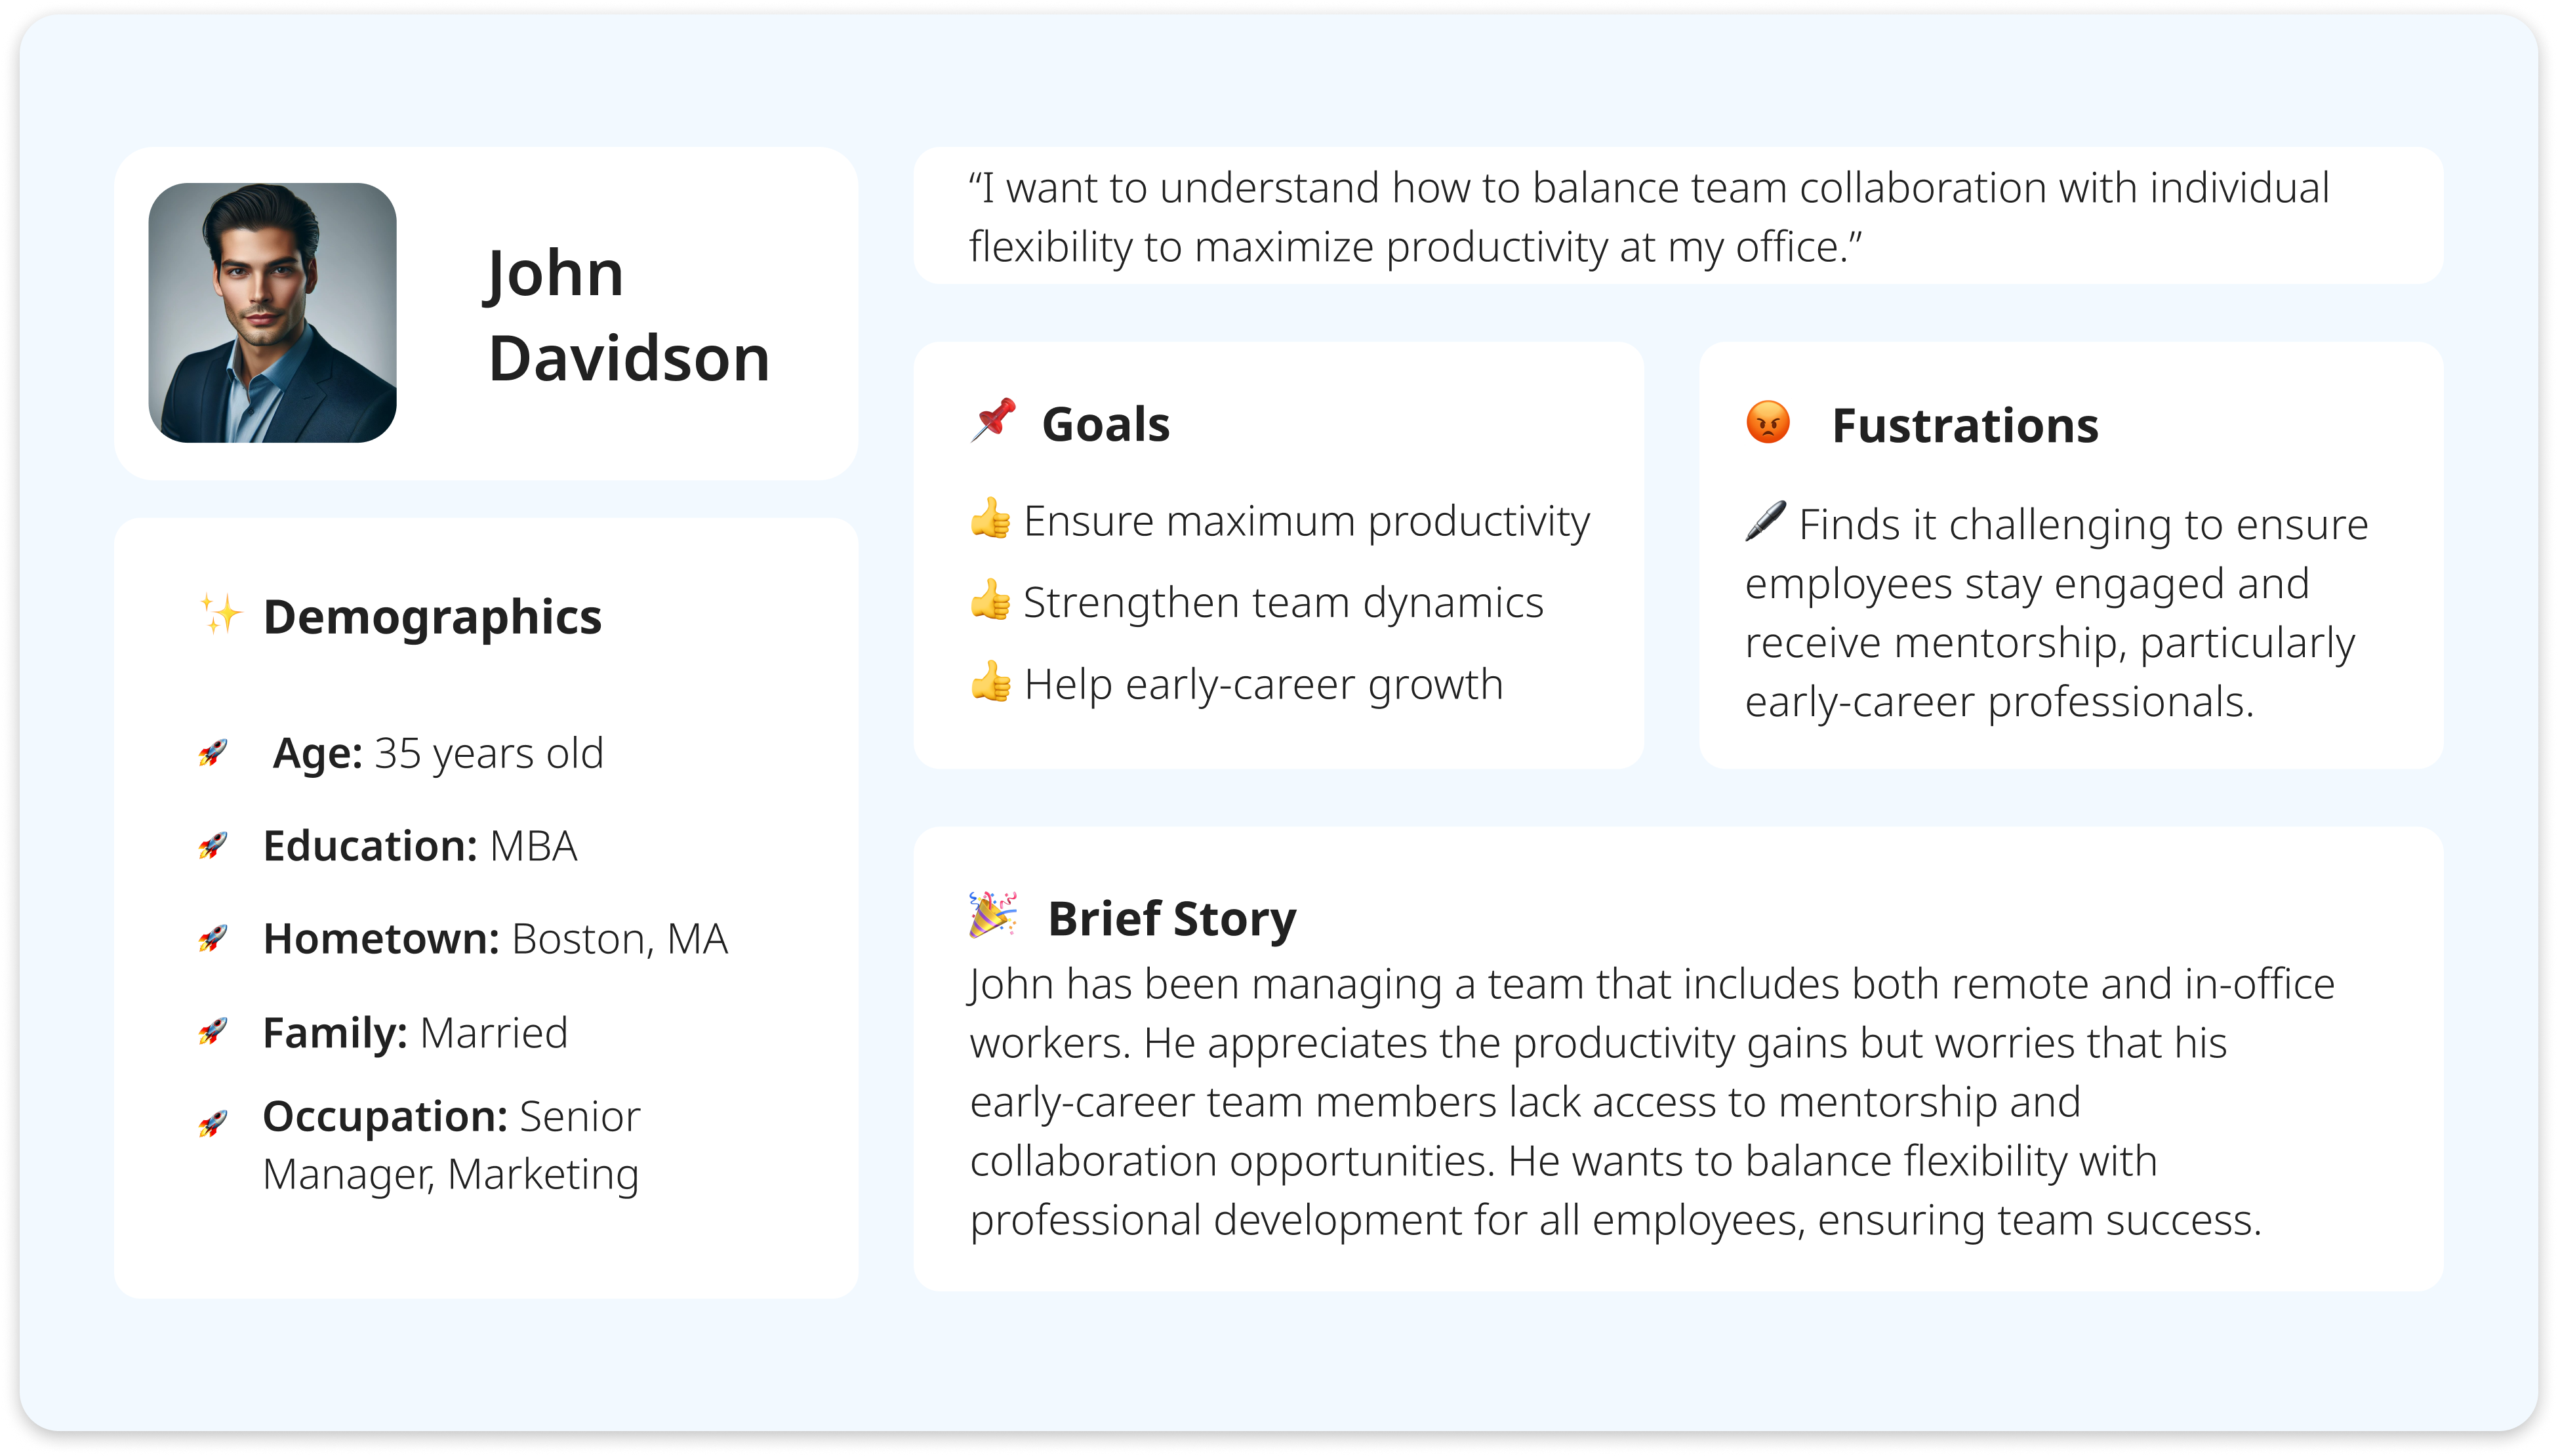
Personas 🙋🏻♀️
Project Structure 🛠️
- Setup: At the pandemic’s beginning, remote work boosted productivity by offering flexibility and eliminating commutes. Gen Z, focused on career growth, saw learning and mentorship as critical but struggled to find these opportunities in a remote setting.
- Conflict: Over time, remote work reduced productivity and made it more difficult for professionals to advance in their careers. New employees onboarded during the pandemic faced additional challenges, feeling excluded and disconnected.
- Resolution: Hybrid work emerged as a solution, combining remote flexibility with in-person collaboration, improving team relationships, and decreasing struggles like burnout and lack of mentorship.
High-Fidelity Wireframes ⿻
Setup
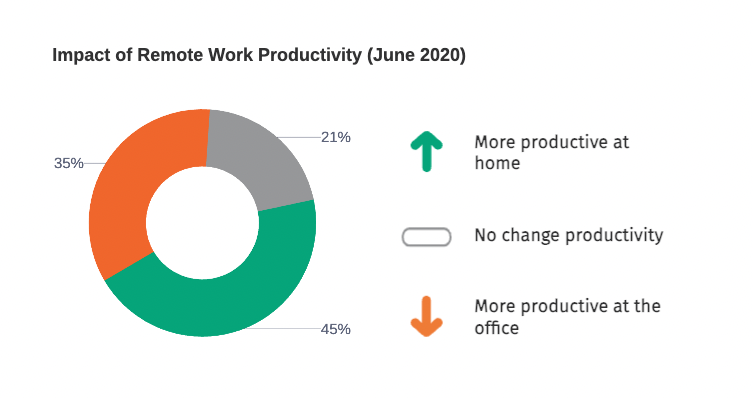
1.Initial increase in productivity at the beginning of covid (June 2020)
At the beginning of COVID-19, when people had just started working from home, we saw an initial surge in productivity as reported by employees. Here is an example from the US (2020):
- Mentorship Importance for Gen Z: As Gen Z entered the workforce, 76% emphasized that continuous learning is critical to their career advancement, highlighting the need for mentorship, which became more difficult to access remotely.
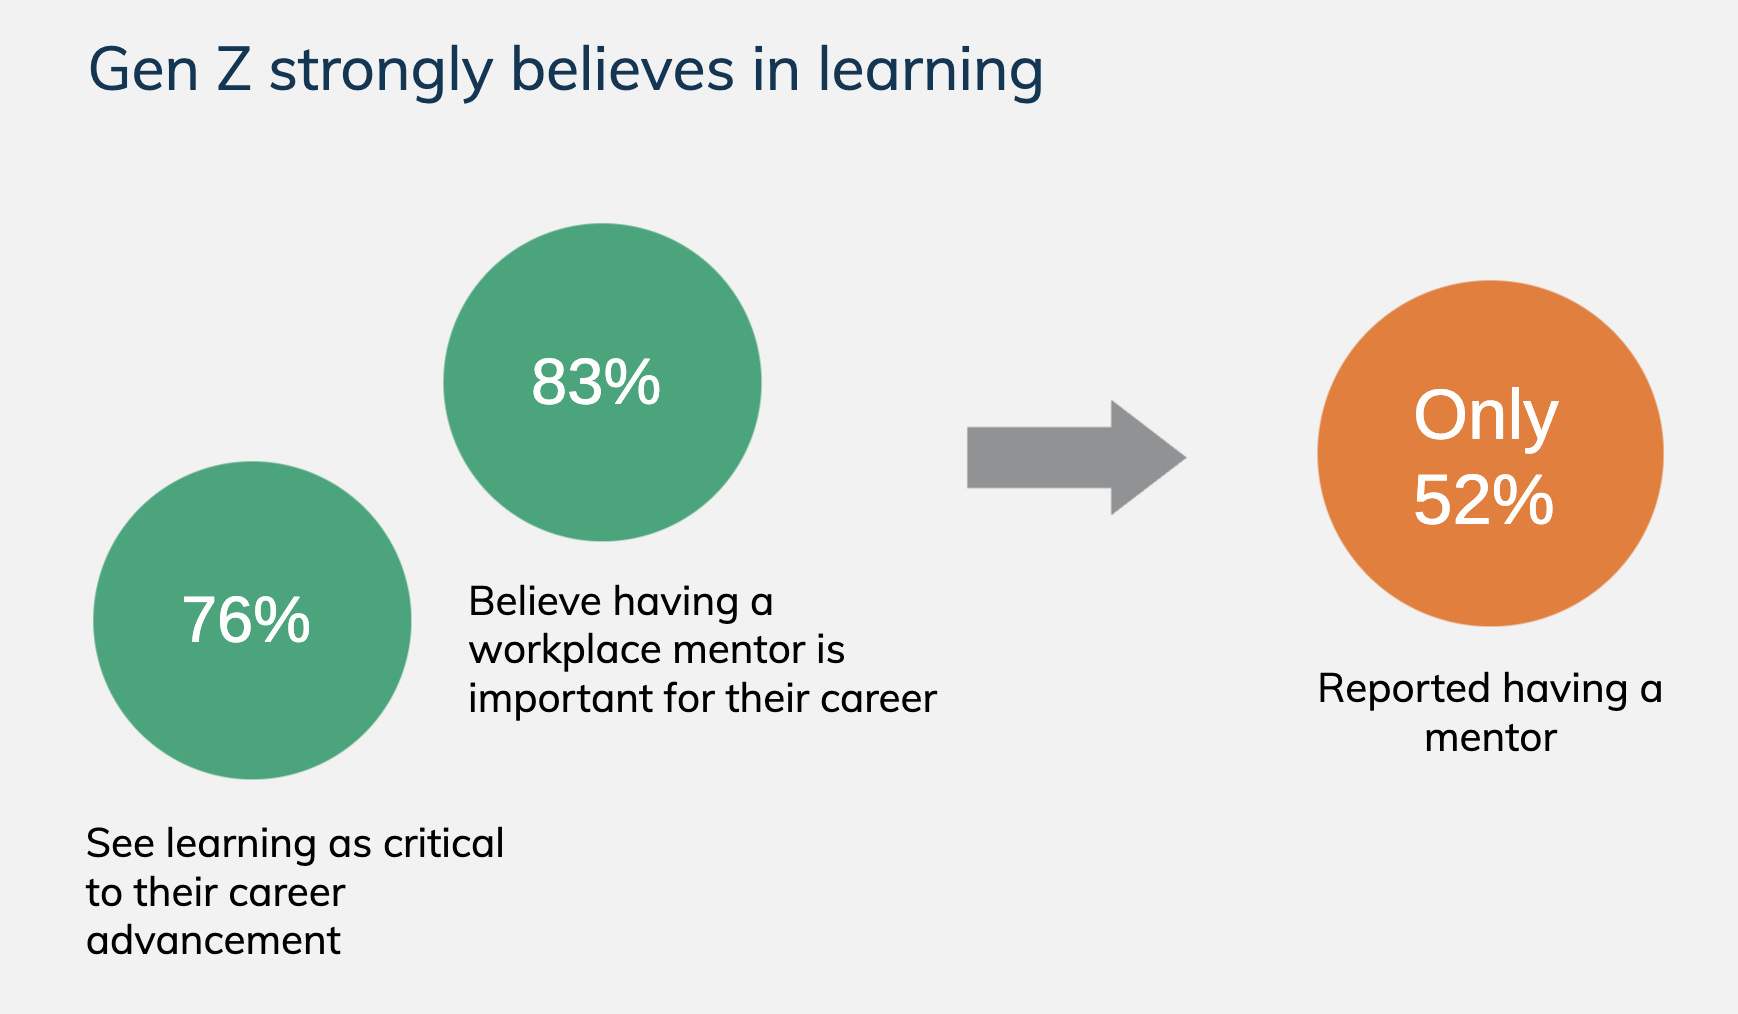
Source: MentorCliq: 40+ Definitive Mentorship Statistics and Research for 2024
Conflict
1.Within a few months, we noticed a drop in productivity levels (output per hour worked).
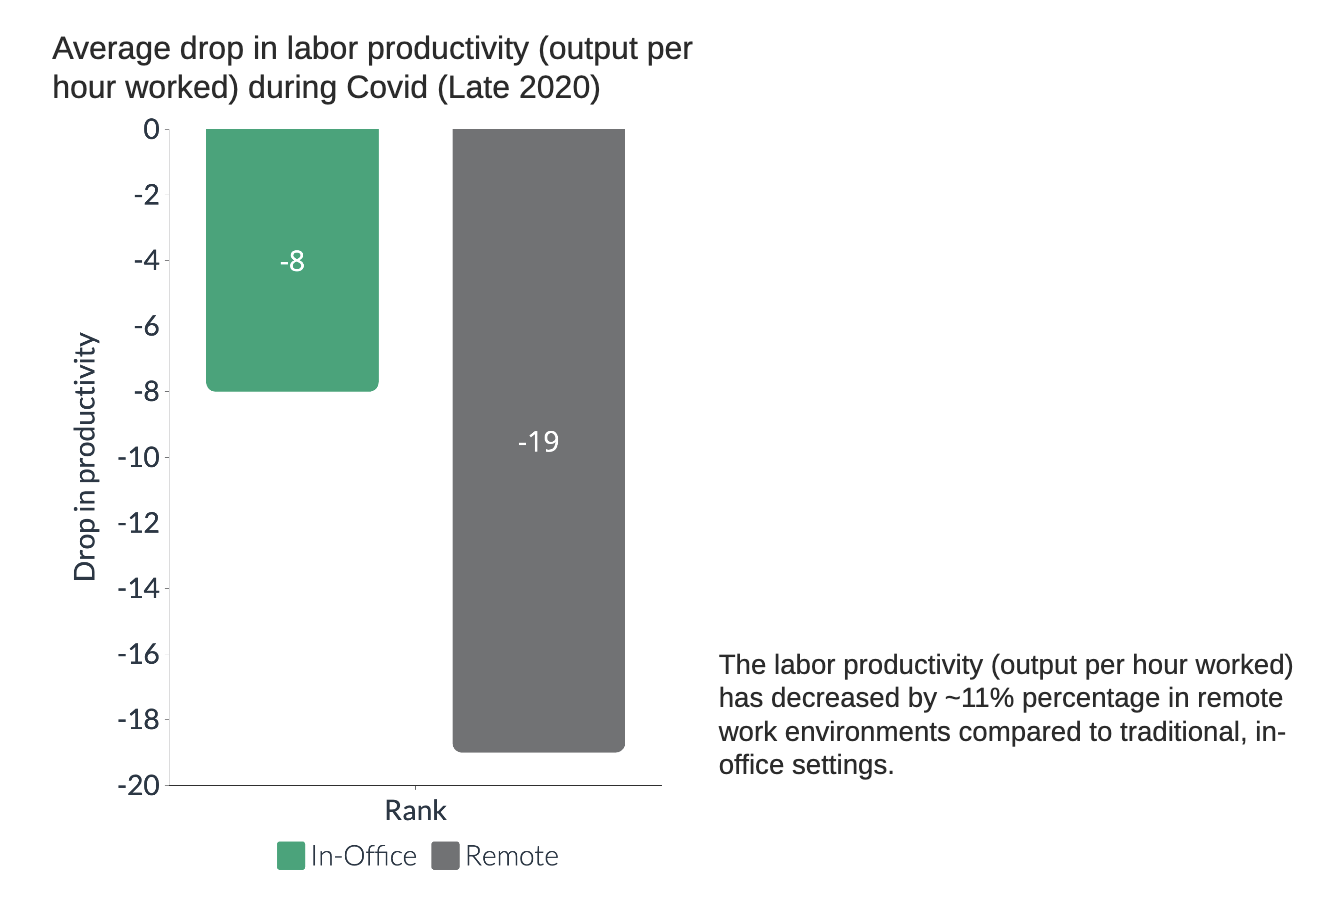
The 8% to 19% drop in productivity is lower than usual productivity levels. This means that labor productivity (output per hour worked) has decreased by that percentage in remote work environments compared to traditional, in-office work settings.
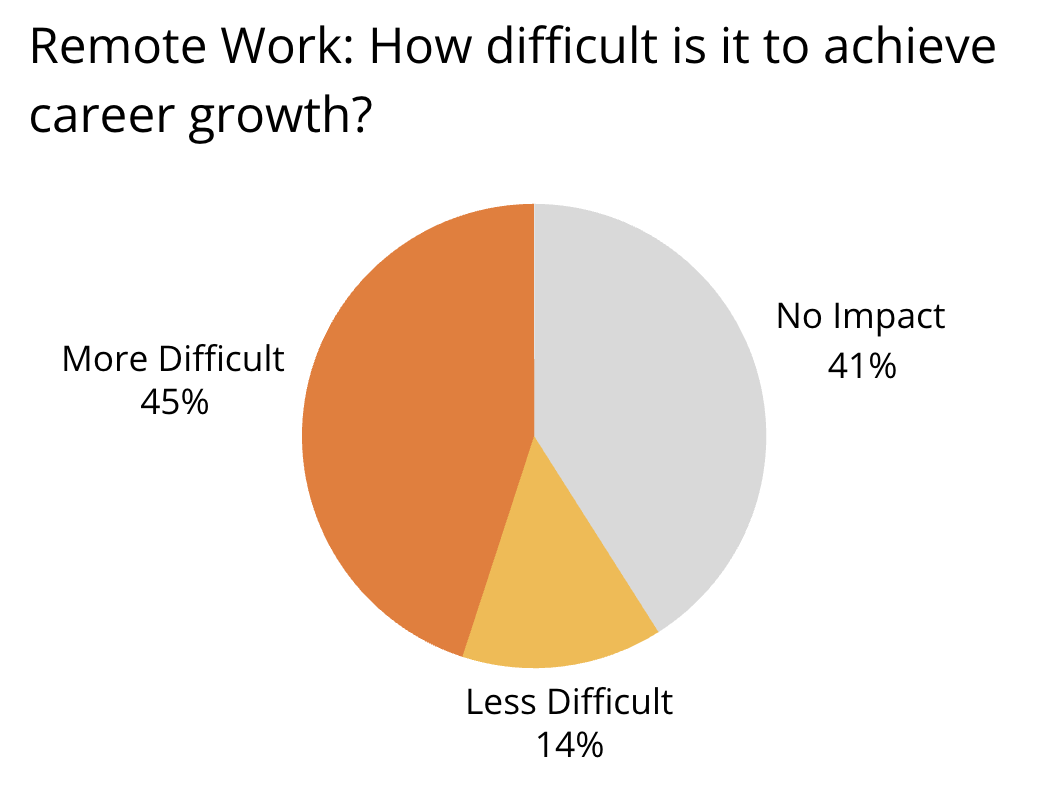
2.Career Progression Difficulties: 45% of early-career professionals felt that remote work made career progression more difficult, as they lacked in-person mentorship and networking opportunities.
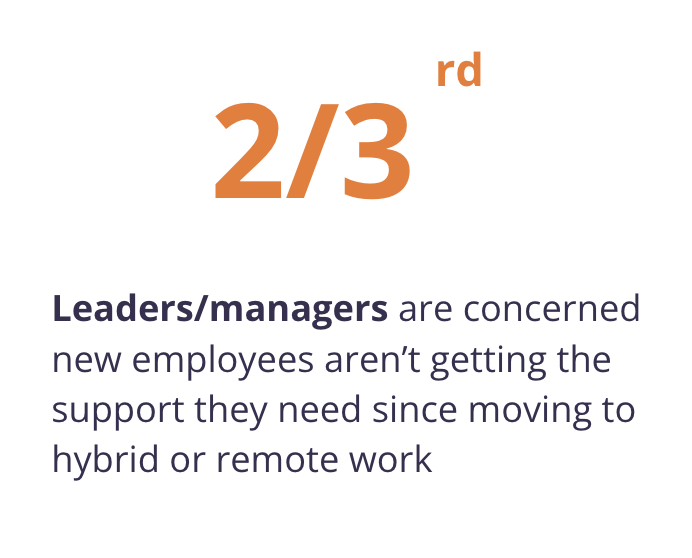
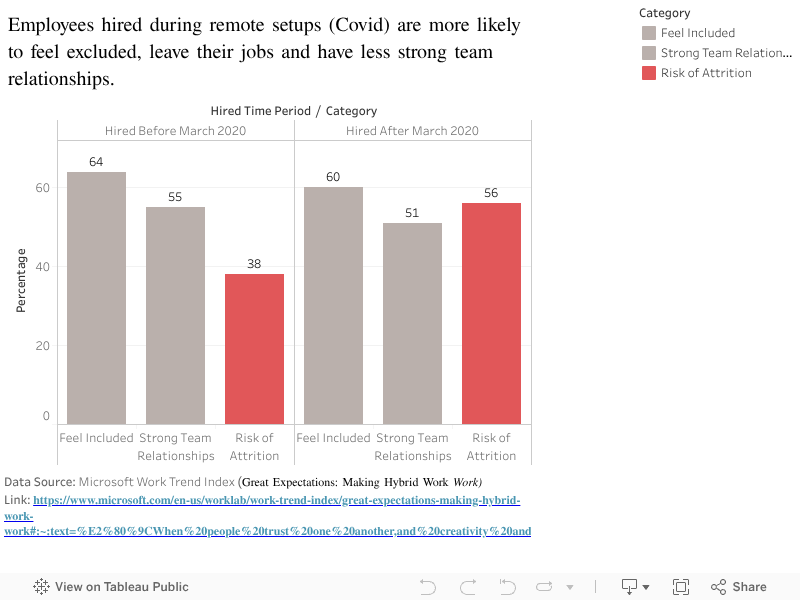
3.Support for New Employees: Employees hired during COVID-19 (After March 2020) struggled more than their in-office counterparts, feeling less connected to their teams and at greater risk of leaving their jobs. Managers are also concerned about the support that new employees are gettings after moving to remote work.
Source: Microsoft Work Trend Index
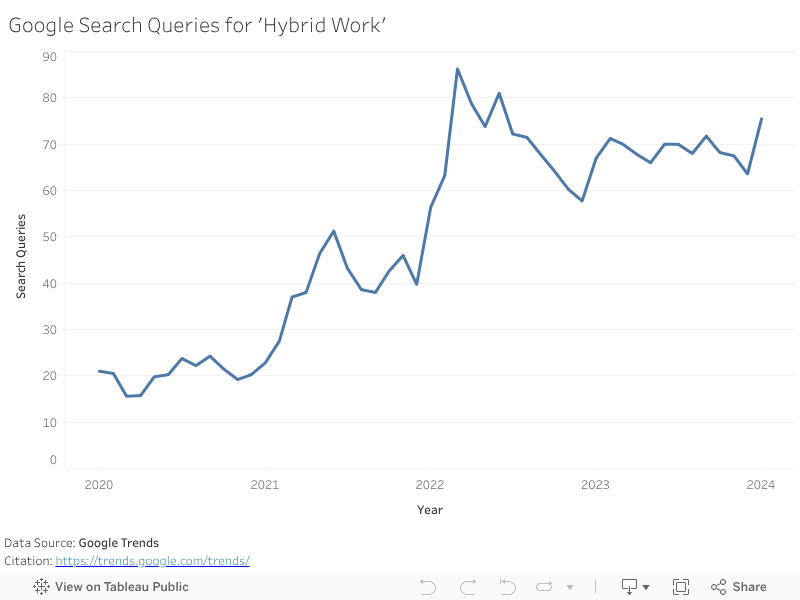
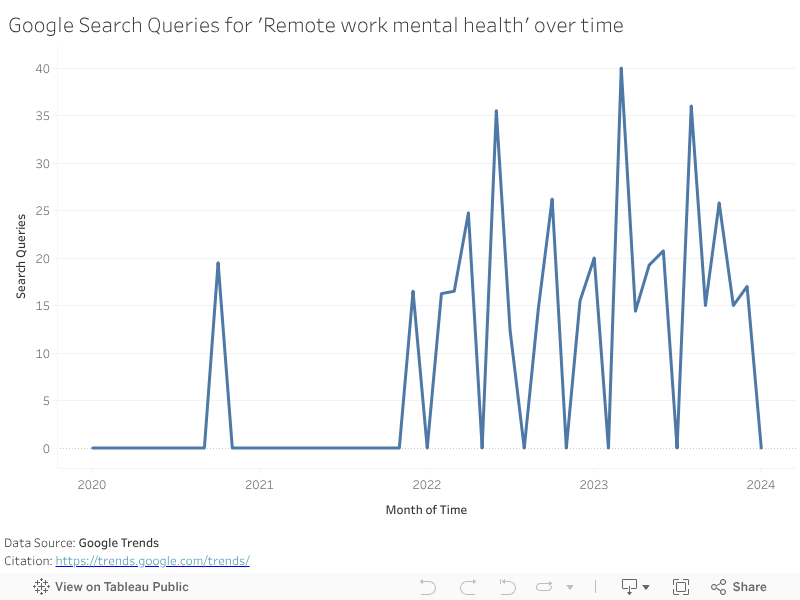
4.Google Trends for search terms like “hybrid work” and “mental health remote work” started surging and spiked during different phases of the pandemic. This shows how concerns about productivity and work-life balance rose over time.
Resolution
1.Hybrid work emerged as the balanced answer, providing both flexibility and structured in-office collaboration to boost engagement and development. We see a decrease in major employee struggles when Hybrid work came into play.
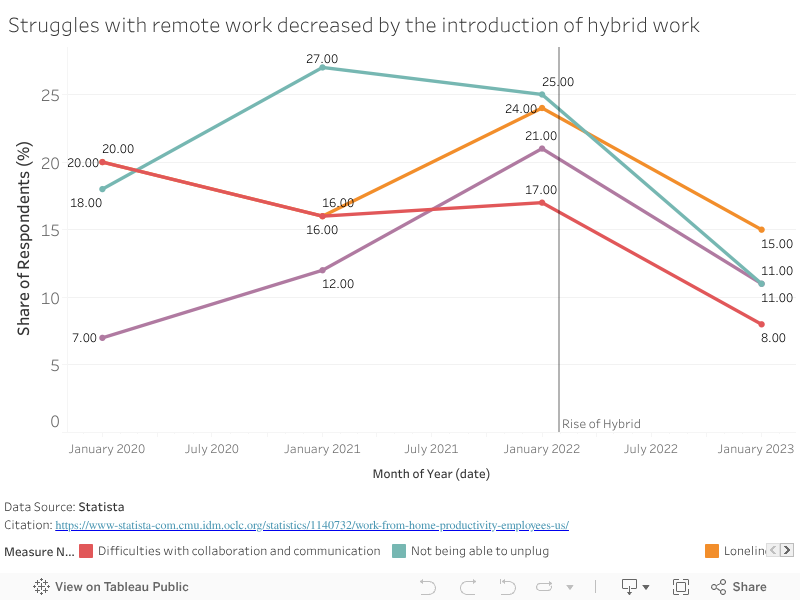
Here, we can see that people struggled a lot in 2021 and 2022, but by 2023, as hybrid work began to take up, these largest issues appeared to have reduced.
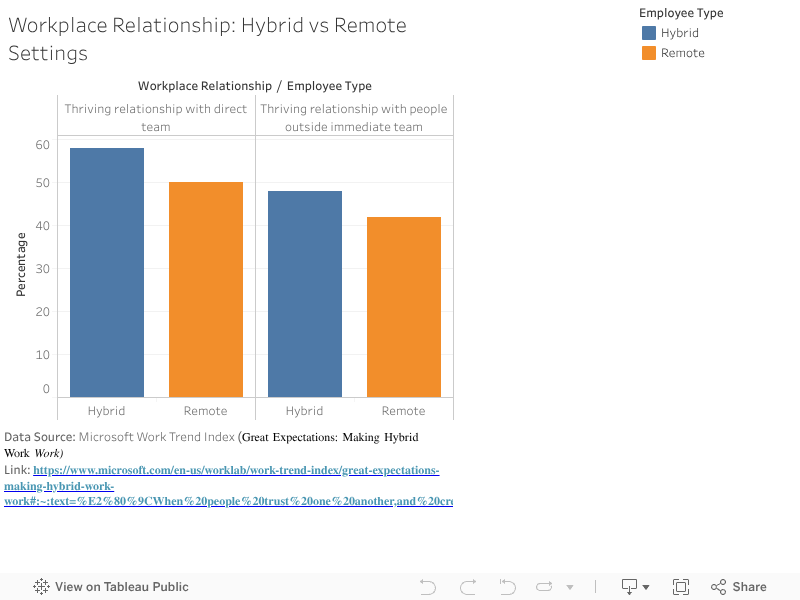
2.Improved Workplace Relationships: We see that hybrid employees were more successful at maintaining relationships with their teams, with many reporting a decrease in struggles like burnout and isolation.
User Research Protocol 📓
A.Target Audience
- Early-Career Professionals: Individuals in their first 1-3 years of work (or entering the workforce soon), balancing productivity, mentorship, and career development in remote/hybrid environments.
- Managers/Team Leaders: Leaders overseeing employees (particularly early-career professionals) in hybrid/remote models, concerned with engagement, productivity, and team collaboration.
B.Approach to Identifying Interviewees
- I reached out to two students and one manager to gather both perspectives: the new grad employee’s experience of navigating productivity and career development in remote/hybrid work, and the manager’s perspective on leading and mentoring employees (particularly early career) in these environments. This ensures a balanced understanding of the challenges and opportunities from both sides, forming the project’s narrative and visualizations.
C.Questions/Script:
- As a grad student entering the job market soon, what part of the story resonates with you the most? Why?
- Does the narrative communicate the trade-offs between remote and hybrid work in terms of career development and productivity?
- Do the visualizations effectively support and enhance the key points in the story?
- Was the flow of the story and visualizations easy to follow? Did the structure make sense?
- Do you have any suggestions for improving the user experience in terms of layout, design, or flow?
D.Findings from User Interviews
-
Graduate student, mid-20s: This student found the challenges of career growth in hybrid environments highly relatable, as they experienced limited in-person interaction and fewer opportunities in their previous job. They appreciated the story arc, stating that it starts with remote work’s impact on productivity and then asks whether remote work affects career growth. They felt the story flow was well-structured, keeping the outcome open and engaging. The student also suggested that a side-by-side comparison visual could make the trade-offs clearer. Additionally, they proposed refining the drop in productivity graph to better emphasize negative trends.
-
Graduate student, mid-20s: This student resonated a lot with the resolution part, particularly how hybrid work improves mentorship, inclusiveness, and team relationships. They found the narrative to be clear but felt it focused too much on the drawbacks of remote work and suggested adding more emphasis on its benefits. They particularly liked the references to sources below each visualization and felt that the two diverse personas at the beginning helped put the story into different perspectives. The student also suggested removing unnecessary visuals (about 2/3rd managers) and noted some minor inconsistencies in subtitles.
-
Manager, mid-40s: The manager mentioned that they resonated with the story’s focus on the challenges of mentorship and career growth for early-career employees in remote work environments. They appreciated how the story highlighted the trade-offs between remote and hybrid work, especially in terms of maintaining engagement and fostering professional development. He mentioned that the visualizations were clear and effective, particularly those illustrating the Google Trends data on the rise/demand of hybrid work. The manager noted that the flow from initial productivity gains in remote work to the challenges of career growth and mentorship was logical and easy to follow. However, they suggested that more side-by-side comparisons of remote vs. hybrid work would make the differences more visually apparent.
E.Changes To Implement
-
Side-by-Side Comparison Visuals: Based on feedback from both graduate students and the manager, I will try to implement more side-by-side comparison visualization that clearly shows the trade-offs between remote and hybrid work models, especially in terms of career development and productivity. This will make it easier for viewers to compare the two models visually in a single graphic.
-
Refining the Drop in Productivity Graph: I will update the productivity graph to better emphasize negative trends, particularly where productivity levels decline in remote work. This could involve using more distinct colors or visual cues (such as arrows or highlights) to make the drop more apparent.
-
Removing Unnecessary Visuals: I will remove the visuals related to “2/3rd managers” that was mentioned as unnecessary. Instead, I’ll simply write this in a text format as part of the story.
-
Fixing Minor Inconsistencies: I will address the inconsistencies in subtitles, particularly in terms of formatting and style (e.g., emoticons), to maintain a cohesive output.
Navigation 🧭
Part I: Project Outline and Brainstorming/Sketches